

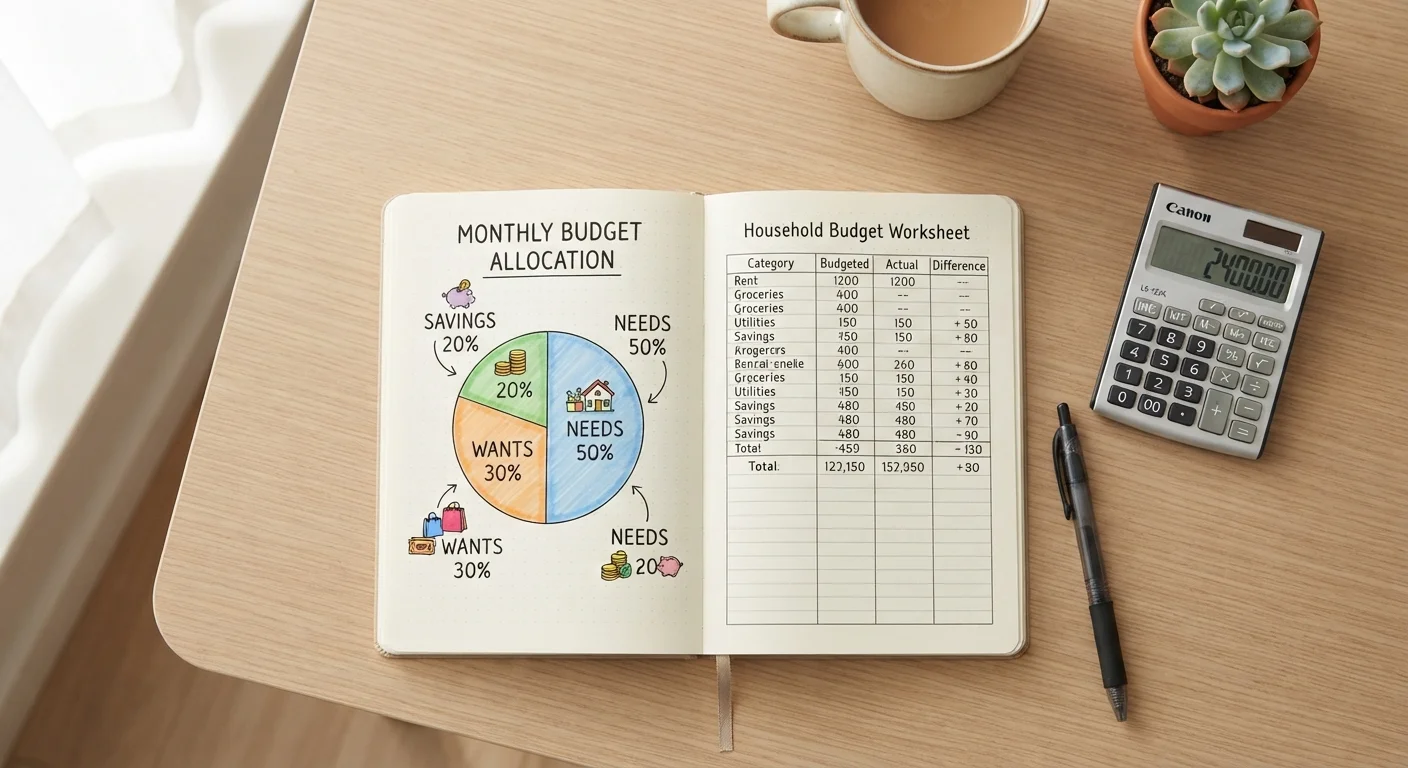
How the Three Buckets Work
The framework's power lies in its simplicity. Once you know your monthly after-tax income, you apply three fixed percentages and create a spending plan in minutes.
- 50% - Needs: Rent or mortgage payments, groceries, utilities, health insurance premiums, minimum loan payments, and transportation required for work. These are non-negotiable obligations.
- 30% - Wants: Dining out, entertainment, travel, clothing beyond basics, subscriptions, and hobby spending. These improve quality of life but could be reduced if necessary.
- 20% - Savings and Debt Repayment: Emergency fund contributions, retirement account deposits, investment contributions, and extra payments on debt above the minimum.
Before applying any percentages, it helps to know exactly where your money is currently going. A spending audit gives you an honest baseline so you're adjusting real numbers rather than guessing.
This article is for general informational and educational purposes only and is not personalized financial advice. Consider consulting a qualified financial professional for guidance specific to your situation.
The Needs Category: What Qualifies
Defining 'needs' rigorously is where most people slip up. A need is something you cannot safely or legally live without - not something that feels essential because you're accustomed to it.
Mortgage or rent, basic food, electricity, water, required insurance, and minimum debt payments clearly qualify. A car payment might qualify if public transit isn't available in your area; a luxury vehicle payment generally doesn't.
High Housing Costs Can Strain the Model
In cities where median rents consume 35-45% of take-home pay for average earners, the 50% needs ceiling is under structural pressure before other bills are counted. Rather than viewing this as a failure of the framework, treat it as useful diagnostic information: your housing cost may be the single largest lever available to improve your overall financial picture.
If your fixed needs already consume more than 50% of take-home pay, the framework still has value - it surfaces a structural problem that needs addressing, whether through income growth, renegotiating fixed expenses, or relocating. See standard household spending categories for a detailed breakdown of what typically falls under each expense type.
The Savings Bucket: Priorities Within the 20%
Not all savings goals are equal in urgency. Most financial educators suggest a sequencing approach within your 20%:
- Build a small starter emergency fund (commonly cited as one month of essential expenses) to avoid going into debt for unexpected costs.
- Capture any employer match in a workplace retirement account - an unmatched match is a forfeit of compensation.
- Aggressively pay down high-interest debt (typically credit cards carrying double-digit rates).
- Grow the emergency fund to three to six months of expenses over time.
- Increase retirement and other long-term investment contributions.
The Saving & Emergency Funds hub offers practical guidance on building reserves and preparing for unexpected financial setbacks as you work through these priorities.
57%
Americans living paycheck to paycheck
According to a 2023 LendingClub report, roughly 57% of U.S. consumers reported living paycheck to paycheck, underscoring why structured budgeting frameworks have broad appeal.
20%
Recommended savings and debt repayment share
The 20% savings target aligns with long-standing guidance from financial educators as a meaningful threshold for building financial resilience over time.
~30%
Average housing share of consumer spending
The U.S. Bureau of Labor Statistics Consumer Expenditure Survey consistently shows housing consuming roughly 30% of average household spending - well within the 50% needs ceiling for median earners.
When to Adjust the Percentages
The 50/30/20 rule is a guideline, not a law. Several real-world situations call for deliberate adjustments:
- High-cost cities: In markets where rent alone can approach 40% of median take-home pay, achieving 50% needs is extremely difficult. Temporarily compressing the wants category - say, to 15% - and treating the rule as an aspirational target makes more practical sense than abandoning the framework entirely.
- Aggressive debt payoff: Someone carrying significant high-interest debt may redirect 30-35% toward debt repayment and savings combined, leaving less for wants until the balance is cleared.
- Near retirement: Savers in the final decade before retirement often push savings well above 20% when income permits, accepting a leaner wants allocation.
For comparison, the case for and against strict budget categories explores how rigid structures can help or hinder depending on your habits and personality.
You might also consider alternatives. Envelope budgeting and digital spending limits work differently - enforcing caps category by category rather than through broad percentages - and may suit different behavioral styles.
Putting the Framework Into Practice
Apply the 50/30/20 rule in three steps:
- Calculate your monthly after-tax income. Include all reliable take-home income: salary, freelance net earnings, side income. Exclude one-time windfalls for the baseline.
- Categorize your current expenses. Pull three months of bank and credit card statements and sort each transaction into needs, wants, or savings. Totals that stray far from the target percentages show exactly where to focus.
- Adjust spending or income. If needs exceed 50%, look for fixed cost reductions. If savings fall below 20%, identify discretionary spending to trim first.
Start With One Month of Real Data
Before adjusting any category, pull actual statements from one full month and tally spending honestly. Most people discover their wants category is larger - and their savings smaller - than they assumed. Real data makes the framework actionable instead of abstract.
After the first month, a structured review locks in progress. The end-of-month budget review walks through how to compare planned versus actual spending and decide what to adjust going forward.